How to Find a Memory Leak: A Practical Guide
A comprehensive, step-by-step guide to locating memory leaks in software using profiling, heap analysis, and safe testing practices. Learn how leaks form, how to reproduce them safely, and how to verify fixes.

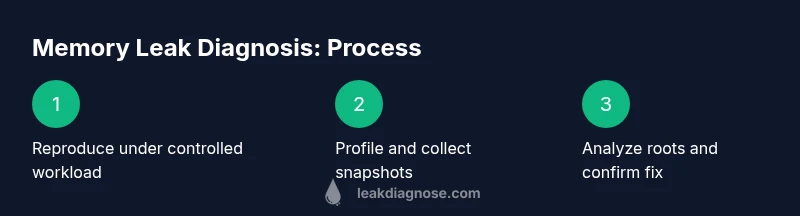
Goal: learn how to find a memory leak in software. Start by reproducing the leak in a controlled environment, enable memory profiling, and collect heap snapshots over time. Identify growing objects and long-lived references, then isolate modules with targeted tests and code review. Validate with a regression test. Keep change logs and document detected roots for future reference.
What memory leaks are and why they matter
A memory leak happens when a program allocates memory and fails to release it after the memory is no longer needed. In languages with automatic garbage collection, leaks are often caused by lingering references, caches, or unintended strong references that keep objects reachable. Even when GC runs, memory can plateau at a high level if objects remain reachable from long-lived roots such as static fields, global registries, or event listeners. The practical consequence is steady memory growth, increased latency, and potential out-of-memory errors in production. For developers and system administrators, understanding how to find a memory leak is essential to maintain performance, reliability, and user satisfaction. The goal is not only to remove leaks but to implement guardrails that prevent similar leaks from creeping back in. In the Leak Diagnosis approach, the focus is on repeatable workflows, evidence from memory profiles, and targeted tests that confirm the root cause before shipping a fix.
Common sources of memory leaks in software
Common sources include stale references in caches, global collections, or singletons that accumulate data; event listeners or observers that are never deregistered; mismanaged resources like file handles or database connections not released; and cyclical references in languages without a robust GC. Another frequent pattern is creating or retaining large data structures during a long-running process, such as polishing large in-memory models or holding onto historical state unnecessarily. In real-world projects, leaks often arise from combinations of these patterns across modules. The key to learning how to find a memory leak is to map memory growth to code paths and lifecycle events, then test each path under realistic workloads.
Profiling foundations: tools and methods
Effective memory-leak detection relies on profiling, heap analysis, and disciplined testing. Choose a memory profiler that suits your language: for Java, tools like VisualVM or YourKit; for .NET, dotMemory or JetBrains Rider's memory tooling; for Python, tracemalloc and objgraph; for C/C++, Valgrind massif or AddressSanitizer. Establish a baseline by running a representative workload and recording memory usage, allocations, and object lifetimes. Learn the difference between peak memory, steady-state memory, and memory thrash, so you can interpret snapshots correctly. A sound approach combines live profiling during a reproduceable workload with post-mortem heap dumps and Root Cause analysis to see which objects persist and why.
Step-by-step workflow overview
To systematically locate a memory leak, follow a clear, repeatable workflow: first identify the scope of the leak, then profile memory while running a controlled workload, inspect memory snapshots, and narrow down suspect code. This workflow scales from small services to large systems. The goal is to move from a broad suspicion to a concrete root cause, validated by tests that would regrow memory if the bug remains. The approach emphasizes observable evidence, incremental narrowing, and documenting each finding so teammates can reproduce the steps.
Reproducing the leak safely and avoiding harm
Before diagnosing a memory leak, set up a dedicated test environment that mirrors production load but avoids live user traffic. Use repeatable test cases to reproduce growth patterns and avoid chaotic, non-deterministic results. Disable nonessential features or services to reduce noise, and introduce controlled workloads that resemble real usage. Record baseline memory, then compare with subsequent snapshots to confirm growth trends. Never profile production services without approval or risk assessment; use feature flags and safe instrumentation to protect data and users.
Practical techniques for diagnosing leaks
Apply practical techniques to move from symptoms to root cause. Start with a memory snapshot comparison across time: look for objects that increase in number or size over repeated runs. Use allocation stacks to identify where allocations originate, then trace how those objects persist. Consider caching strategies, observer patterns, and event subscriptions as likely culprits. When you pinpoint a suspect module, write focused unit or integration tests that reproduce the leak, and verify the fix by re-running the profiling sequence. Finally, add monitoring to catch regression, such as alerting on unexpected memory growth or GC pauses.
Authority sources
Sources you can consult for deeper understanding include official language documentation and memory-management best practices. Oracle’s Java GC tuning guide explains how collectors interact with heap memory; Python’s tracemalloc docs describe practical heap tracing; and Microsoft’s memory-management guidance covers garbage collection and memory patterns in .NET. Refer to these resources when designing a robust leak-detection workflow.
Practical tips to avoid memory leaks in the future
- Build a culture of regular memory profiling into your CI pipeline. - Ensure caches have eviction policies and do not retain stale data for longer than necessary. - Create automated regression tests that exercise long-lived workloads to catch leaks early. - Document memory-management decisions so future changes do not reintroduce leaks. - Monitor production memory charts and set alerts for unexpected growth.
Tools & Materials
- Memory profiler for your language(e.g., VisualVM or YourKit for Java; dotMemory for .NET; tracemalloc for Python; Valgrind for C/C++)
- Heap dump/recording capability(Ability to capture live memory snapshots over time)
- Representative workload(A repeatable test case that mirrors production usage)
- Code instrumentation libraries(Optional for custom tracking in some ecosystems)
- Logging and tracing framework(Correlate memory events with operations)
- Safe test environment(Isolate from production to avoid impacting users)
- Baseline memory measurement tool(Helps establish starting memory levels)
- Automation scripts for snapshots(Schedule and automate memory captures)
Steps
Estimated time: 2-4 hours
- 1
Reproduce the leak consistently
Create a deterministic, repeatable workload that triggers the leak under controlled conditions. Start with a clean baseline memory measurement and document the exact sequence used to reproduce the issue.
Tip: Use a minimal test case that represents typical production behavior to reduce noise. - 2
Choose a profiling approach
Select memory profiling tools appropriate for your language and environment. Decide whether you’ll profile live memory, use heap dumps, or both.
Tip: Some tools require instrumentation; plan time for setup. - 3
Capture memory snapshots over time
Take multiple memory snapshots at regular intervals during the workload. Compare snapshots to identify objects that grow in size or instances that persist.
Tip: Automate snapshot collection to avoid missing intermediate states. - 4
Analyze heap dumps for growing objects
Sort by size and by reference count. Identify objects that increase across snapshots and list their constructors or allocation sites.
Tip: Look for patterns like oversized caches or accumulating data structures. - 5
Trace lifetimes and root references
Follow references from roots to the suspected objects to determine why they aren’t collected. Pay attention to static fields, singletons, and event listeners.
Tip: Check for unintended strong references that prevent GC from collecting. - 6
Isolate suspect code paths
Narrow the bleeding edge to a small module or function. Disable features one by one to see memory impact and reproduce the leak in isolation.
Tip: A focused test makes it easier to verify a fix. - 7
Apply a fix and test memory regression
Implement the memory-management fix, then re-run profiling to confirm memory stabilizes. Add a regression test that would fail if the leak returns.
Tip: Run long-running stress tests to ensure persistence isn’t reintroduced. - 8
Set up monitoring to catch future leaks
Add memory-growth alerts and dashboards. Establish a routine to re-profile periodically and after major changes.
Tip: Automate monitoring so leaks are caught early without manual effort.
Questions & Answers
What is a memory leak in programming?
A memory leak occurs when a program allocates memory but fails to release it after it is no longer needed, causing memory usage to grow over time. Leaks are often caused by lingering references or unbounded caches and can occur even in managed languages. The impact is slower performance and potential outages if the leak is not addressed.
A memory leak is when memory is allocated but not released, causing growth over time.
How can I tell if I have a memory leak?
Look for steady memory growth during a constant workload, followed by GC activity that does not reclaim memory. In production, watch for rising memory trends and increased pauses. Correlate growth with specific operations or timelines to pinpoint the source.
Watch for memory growing over time even when workload stays the same.
Which tools should I start with for memory leaks?
Begin with language-appropriate profilers and heap analyzers (examples include Java VisualVM, .NET dotMemory, Python tracemalloc). Use heap dumps and allocation stacks to trace origins, then narrow to suspect modules with targeted tests.
Start with language-specific memory profilers and heap dumps to trace origins.
Can memory leaks occur in managed languages like Java or C#?
Yes. Garbage collectors help reclaim memory, but leaks happen when objects persist because of lingering references, event listeners, or caches that aren’t cleared. Profiling is essential to detect these scenarios.
Managed languages can still leak memory if references keep objects alive.
What’s the difference between a memory leak and high memory usage?
High memory usage means the program is using a lot of memory, which may be normal under heavy load. A memory leak causes memory to grow without bound due to unreleased allocations, often continuing over time even as workload stays constant.
High usage can be normal; leaks keep growing memory instead.
How can I prevent memory leaks in the future?
Adopt a proactive memory-management policy: profile regularly, implement proper cleanup, avoid static caches that grow, deregister listeners, and add automated regression tests that detect growth in memory over time.
Prevention comes from proactive profiling and good cleanup habits.
Watch Video
Main Points
- Define leak scope clearly and basel ine memory
- Use repeatable workloads for reproducibility
- Narrow down suspects with heap-life analysis
- Verify fixes with regression tests and monitoring
- Integrate memory profiling into CI for prevention